קובץ:Ipcc2007 figure-1-2-l.png
לקובץ המקורי (700 × 718 פיקסלים, גודל הקובץ: 279 קילו־בייטים, סוג MIME: image/png)
תקציר
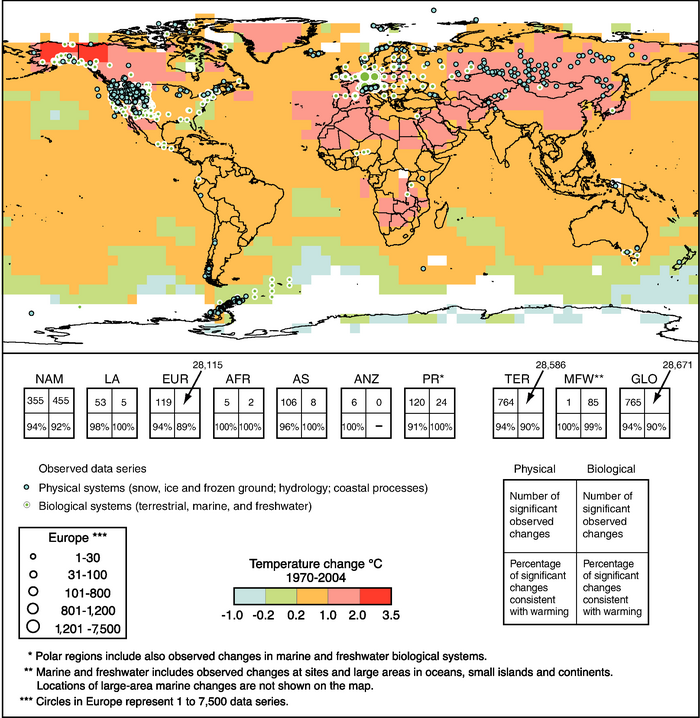
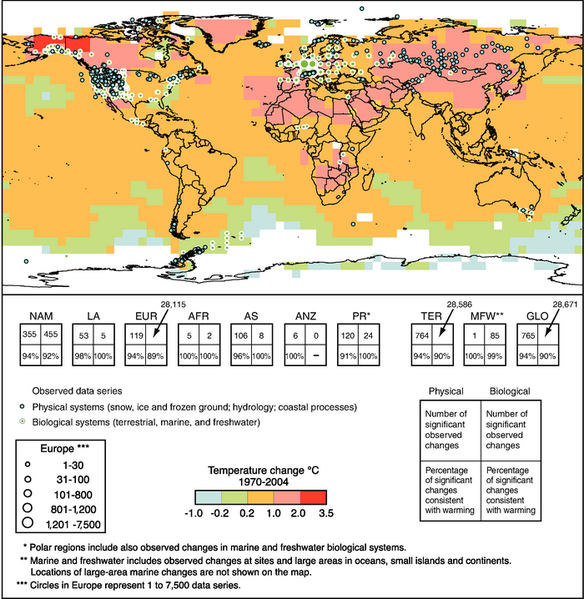
תמונה מתוך דוח 4 של ה-IPCC - מיקומים של שינויים משמעותיים בסדרות נתונים של מערכות פיזיקליות (שלג, קרח וקרקע קפואה; הידרולוגיה ותהליכים בחוף) ומערכות ביולוגיות (יבשתיות, ימיות ושל מים מתוקים), מוצגות יחד עם שינויים בטמפרטורה של האוויר בתקופה 1970-2004. תת-קבוצה של כ-29,000 סדרות נתונים נבחרה מתוך כ-80,000 סדרות נתונים, מתוך 557 מחקרים. אלו ענו על כמה קריטריונים : (1) הסתיימו בשנת 1990 או מאוחר יותר, (2) נמשכו על פני 20 שנה לפחות (3) הצביעו על שינוי מהותי בכיוון כלשהו, כפי שהוערך במחקרים אינדיבידואלים.
Figure 1.2. Locations of significant changes in data series of physical systems (snow, ice and frozen ground; hydrology; and coastal processes) and biological systems (terrestrial, marine, and freshwater biological systems), are shown together with surface air temperature changes over the period 1970-2004. A subset of about 29,000 data series was selected from about 80,000 data series from 577 studies. These met the following criteria: (1) ending in 1990 or later; (2) spanning a period of at least 20 years; and (3) showing a significant change in either direction, as assessed in individual studies. These data series are from about 75 studies (of which about 70 are new since the TAR) and contain about 29,000 data series, of which about 28,000 are from European studies. White areas do not contain sufficient observational climate data to estimate a temperature trend. The 2 x 2 boxes show the total number of data series with significant changes (top row) and the percentage of those consistent with warming (bottom row) for (i) continental regions: North America (NAM), Latin America (LA), Europe (EUR), Africa (AFR), Asia (AS), Australia and New Zealand (ANZ), and Polar Regions (PR) and (ii) global-scale: Terrestrial (TER), Marine and Freshwater (MFW), and Global (GLO). The numbers of studies from the seven regional boxes (NAM, …, PR) do not add up to the global (GLO) totals because numbers from regions except Polar do not include the numbers related to Marine and Freshwater (MFW) systems. Locations of large-area marine changes are not shown on the map. {WGII Figure SPM.1, Figure 1.8, Figure 1.9; WGI Figure 3.9b}
מקור
https://www.ipcc.ch/publications_and_data/ar4/syr/en/figure-1-2.html
רישיון
| המשתמש שהעלה תמונה זו, יש לערוך תבנית זו ולציין את שם המשתמש, מצהיר בזאת כי הוא מוותר על כל זכויות היוצרים על התמונה, ומשחרר אותה לרשות הציבור. הודעה זו תקפה בכל העולם.
במספר מדינות (וייתכן שגם בישראל) זה אינו אפשרי מבחינה חוקית; במקרה זה: המשתמש שהעלה תמונה זו, יש לערוך תבנית זו ולציין את שם המשתמש, מעניק לכל אחד את הזכות להשתמש בעבודה זו לכל מטרה, ללא תנאים כלשהם, אלא אם כן תנאים אלה נדרשים על ידי החוק. |
היסטוריית הקובץ
ניתן ללחוץ על תאריך/שעה כדי לראות את הקובץ כפי שנראה באותו זמן.
| תאריך/שעה | תמונה ממוזערת | ממדים | משתמש | הערה | |
|---|---|---|---|---|---|
| נוכחית | 15:46, 12 באוקטובר 2015 | | 700 × 718 (279 קילו־בייטים) | האזרח דרור (שיחה | תרומות) | תמונה מתוך דוח 4 של הIPCC - מיקומים של שינויים משמעותיים בסדרות נתונים של מערכות פיזיקליות (שלג, קרח וקרקע קפואה; הידרולוגיה ותהליכים בחוף)... |
אין באפשרותך לדרוס את הקובץ הזה.
שימוש בקובץ
הדפים הבאים משתמשים בקובץ הזה: